The new CTA generation. Video (EN/DE)
The new CTA generation. Video (EN/DE)
The traditional CTA model can largely be explained with a slow-moving momentum model which is applied to a diversified universe of underlying markets. We have observed two trends of new generation CTAs:
Firstly, technology driven. These CTAs employ artificial intelligence, machine learning, big data, and deep learning techniques or also use high frequency trading techniques to identify trends in financial markets or to profit from mispricings in related markets, sometimes in a split second.
Secondly, risk premia driven. These models view momentum as only one risk premium to explain economic fundamental return drivers in financial markets and explore additional risk premia such as carry, value, liquidity, or term structure to monetise complex market phenomena.
J8 Capital Management is of the latter kind. We not only diversify asset class risk, but also mathematical model risk.
The new CTA generation. Video (EN/DE)
Herkömmliche CTA Modelle basieren auf sich langsam bewegenden Momentum Modellen, die auf breit gefächerte Märkte angewendet werden. Wir haben zwei Trends in der nächsten Generation von CTAs ausgemacht:
Zum einen technologiegetrieben: Das sind CTAs, die Methoden der künstlichen Intelligenz, Maschinenlernen, Big Data, Deep Learning, aber auch des Hochfrequenzhandels anwenden, um Preisdifferenzen im Bruchteil von Sekunden zu erkennen und auszunutzen.
Die zweite Gruppe wird von der Ausnutzung von Risikoprämien getrieben: Das sind CTAs, die Momentum als nur eine von vielen Risikoprämien betrachten, um die Komplexität der Märkte zu erklären. Sie suchen nach weiteren Erklärungen mit Hilfe von Carry-, Value-, Termin- oder Liquiditätsprinzipien.
J8 Capital Management LLP gehört der zweiten Gattung an: Wir sind nicht nur über die Anlageklassen sondern auch über mathematische und wirtschaftliche Modelle hinweg diversifiziert. |
UCITS CTA structures. Video (EN/DE)
Traditionally, CTAs are offered to investors as Managed Accounts or in off-shore fund structures. In 1985, the EU introduced the Undertaking for Collective Investments in Transferable Securities Directive, commonly referred to as UCITS, to create a single market in the EU for public fund offerings. Since the financial crisis in 2008, an increasing number of investors consider UCITS funds as their preferred choice of investment vehicle because of the additional protections UCITS offers.
Under UCITS, however, a fund may not hold commodity futures because of the risk of physical delivery.
For commodity trading advisors, or CTA, that is a problem they need to carefully address. Over the years, three solutions have emerged:
In the first solution, CTAs strip out the commodity component of their entire trading program. This, however, leads to explaining the performance differences between their off-shore and UCITS offering.
In the second solution, CTAs wrap their entire program, or just the commodity component, into a delta-1 certificate, which the UCITS fund can buy with up to 10% maximum exposure per issuer. The certificate is likely highly leveraged due to the issuer constraint. Also, the certificate structure requires additional structuring and administration and adds more cost layers. Investors often frown upon certificate solutions for the lack of transparency and heightened risk.
In the third solution, the CTA defines its commodity component as ESMA compliant Financial Indices, and the UCITS fund then trades performance swaps on these indices. Here, however, the CTA needs to give away its Intellectual Property to an independent index provider, and the index methodology is subsequently published and has to be accessible by any member of the public. In addition, the index regulation requires certain diversification rules and trading frequencies which cannot be met by every CTA.
At J8 Capital, we chose the third solution. We structured our commodity component as Financial Indices. This offers the greatest transparency to investors and is the most efficient way for implementing our investment strategy in our UCITS offering.
Herkömmlich werden CTAs Investoren als Managed Accounts oder offshore Fonds angeboten. 1985 wurde von der EU die Undertaking for Collective Investments in Transferable Securities Directive, kurz UCITS, eingeführt, um das Angebot von Publikumsfonds innerhalb der EU zu harmonisieren. Wegen der zusätzlichen Sicherheiten die UCITS bietet, betrachten seit der Finanzkrise 2008 immer mehr Investoren UCITS als die präferierte Form um ihre Mittel anzulegen.
Um des Risiko der physischen Lieferung von Rohstoffen auszuschließen dürfen unter UCITS keine Rohstofffutures gehandelt werden.
Das ist für jeden Commodity Trading Advisor, oder CTA, ein Problem das er besonders adressieren muss. Hier haben sich drei gängige Lösungen herausgebildet:
In der ersten Lösung wird die Rohstoffkomponente komplett aus dem Programm herausgenommen. Das führt jedoch zu Erklärungsbedarf zwischen der offshore und der UCITS Performance.
In der zweiten Lösung verbrieft der CTA sein komplettes Programm oder auch nur die Rohstoffkomponente, mit einem Delta-1 Zertifikat, das dann wiederum vom UCITS Fonds mit bis zu 10% des Fondsvermögens je Emittent gekauft werden darf. Dies hat den Nachteil, dass das Zertifikat einen enormen Hebel haben kann. Zudem bedarf die Zertifikatestruktur zusätzliches Strukturieren und Administration, was die Kosten in die Höhe treibt. Oftmals werden solche Zertifikatestrukturen wegen ihrer mangelnden Transparenz und dem erhöhten Risiko nicht gerne von Investoren gesehen. Das UCITS Durchschauprinzip endet auf Zertifikatebene, und es wird nicht betrachtet, was innerhalb des Zertifikates passiert.
Als dritten Lösungsweg kann der CTA seine Rohstoffkomponente als ESMA konforme Finanzindizes definieren und Swaps darauf handeln. Bei dieser Lösung jedoch gibt der CTA sein geistiges Eigentum preis. Er übergibt es einer unabhängigen Indexberechnungsstelle, die wiederum die Indexmethodik veröffentlicht und der Öffentlichkeit zugänglich machen muss. Zudem stellt die Indexzulassung Anforderungen an Diversifikation und Handelsfrequenz, die nicht jeder CTA erfüllen kann.
Bei J8 Capital Management LLP haben wir uns für den dritten Weg entschieden. Wir strukturieren unserer Rohstoffkomponente als ESMA konforme Finanzindizes. Damit geben wir dem Investor die größtmögliche Transparenz und auch den effizientesten Weg unser volles Programm im UCITS Fonds umzusetzen.
J8: The How and Why. Video (EN/DE)
J8: The How and Why
How do we generate systematic global absolute returns and why the way we choose to?
J8: Das Wie und Warum
Wie erwirstschaften wir systematische Global Absolute Returns und warum auf diese Weise?
Is investment in CTAs a crowded trade? Video (EN/DE)
Is investment in CTAs a crowded trade?
Recently, an investor asked if investing in CTAs was investing in a crowded trade. We think not!
Firstly, according to the Bank of International Settlement, the total notional outstanding in derivatives in 2016 was 444 trillion dollars. CTAs manage approximately 350 billion dollars. Assuming an average leverage of 200% across the CTA and Managed Futures industry, the CTAs hold 700 billion dollars in notional outstanding which is only 0.16% of the total derivatives notional outstanding.
Ist ein CTA Investment ein Crowded Trade?
Vor kurzem hat ein Investor gefragt, ob CTAs ein “Crowded Trade“ seien. Wir denken nicht.
Zum einen beläuft sich das globale Gesamtvolumen aller ausstehenden Derivate laut der Bank of International Settlement, auf 444 Billionen Dollar. CTAs verwalten etwa 350 Milliarde Dollar. Wenn wir einen durchschnittlichen Hebel von 200% für die CTA und Managed Futures Industrie annehmen, halten CTAs lediglich 0.16% am Gesamtmarkt.
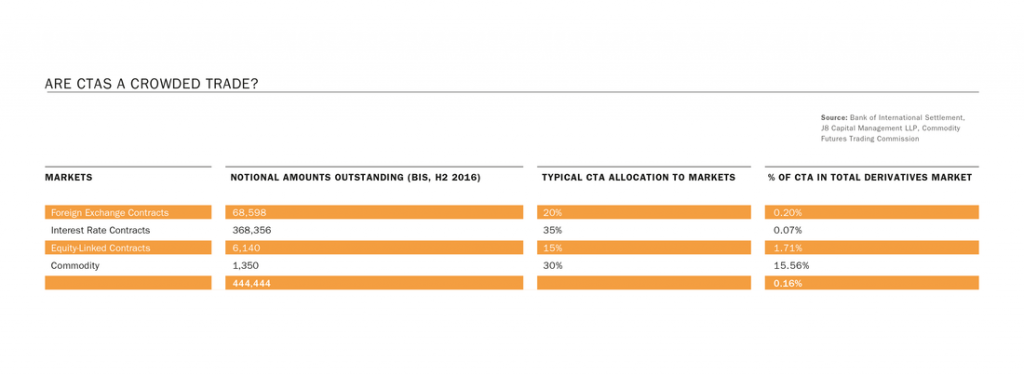
Secondly, we are looking at segments and the most crowded markets: The typical CTA allocation holds 35% in bonds and interest rates, 30% in commodities, 20% in currencies, and 15% in equity linked derivatives. According to BIS data, commodities are the smallest derivatives segment with total notional outstanding of 1.35 trillion dollars. Using the same assumptions as above, 15% of total notional outstanding in commodities is being held by CTAs. This matches CFTC data suggesting that about 15% of commodity futures are held by speculators.
In respect of the total global derivatives markets and the US Treasury’s definition of a crowded trade, we conclude that CTAs have such small and dissimilar positions that they offer little risk in terms of insufficient liquidity, should market participants seek to unwind their positions simultaneously. CTAs are therefore not a crowded trade.
Zum anderen betrachten wir die einzelnen Marktsegmente: Ein typischer CTA hält 35% in Renten und Zinsen, 30% in Rohstoffen, 20% in Währungen, und 15% in Aktienderivaten. Laut der BIS Daten bilden die Rohstoffe mit 1.35 Billionen Dollar in ausstehenden Derivaten das kleinste Segment. Unter gleichen Annahmen wie zuvor halten CTAs etwa 15% an diesem Segment. Dies trifft auch mit CFTC Daten überein, wonach ca. 15% der Rohstoffe von Spekulanten gehalten werden.
Unter Berücksichtigung der Definition des US Finanzministeriums zu Crowded Trades und aufgrund der Tatsache, dass CTAs zum Einen nur einen verhältnismäßig kleinen Anteil des Gesamtmarktes ausmachen und dieser zum Anderen stark diversifiziert ist, stellen CTAs kein Risiko zur Marktliquidität dar, selbst bei gleichzeitiger Auflösung aller Positionen aller CTAs kommen. Somit sind CTAs kein Crowded Trade.
Sources:
https://definedterm.com/crowded_trade
http://www.bis.org/
http://www.cftc.gov/index.htm
https://www.barclayhedge.com/
http://www.j8capital.com/j8-cta-index.html
Portfolio diversification with CTAs. Video (EN/DE)
Portfolio diversification with CTAs
Portfoliodiversifikation mit CTAs
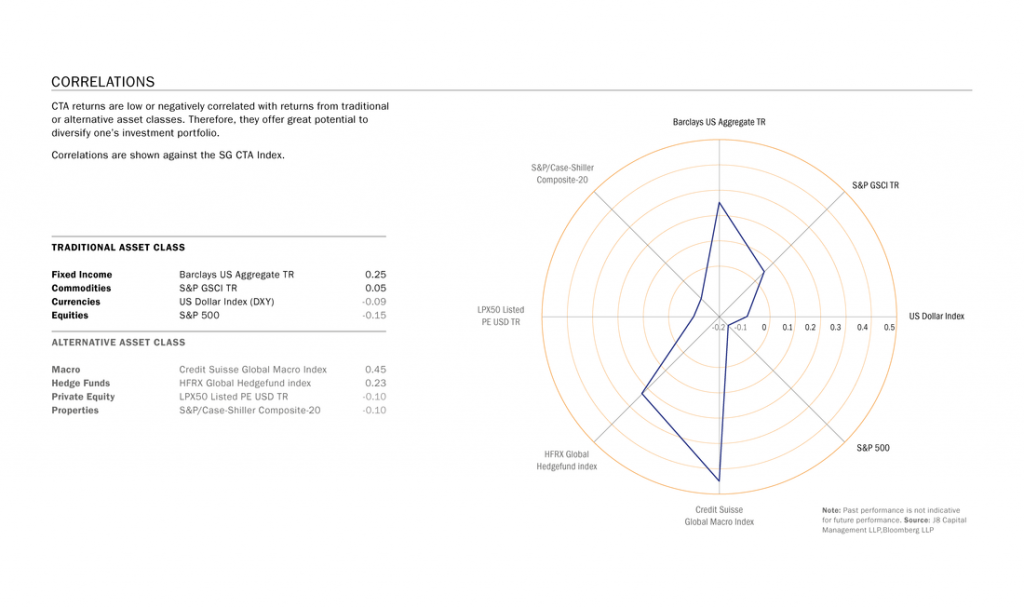
CTA returns are low or negatively correlated with returns from traditional or alternative asset classes. Therefore, they offer great potential to diversify one’s investment portfolio.
CTA Renditen zeigen eine geringe oder negative Korrelation mit sowohl traditionellen als auch Alternativen Anlageklassen. Deshalb eignen sie sich zur Diversifikation bestehender Anlageportfolien.
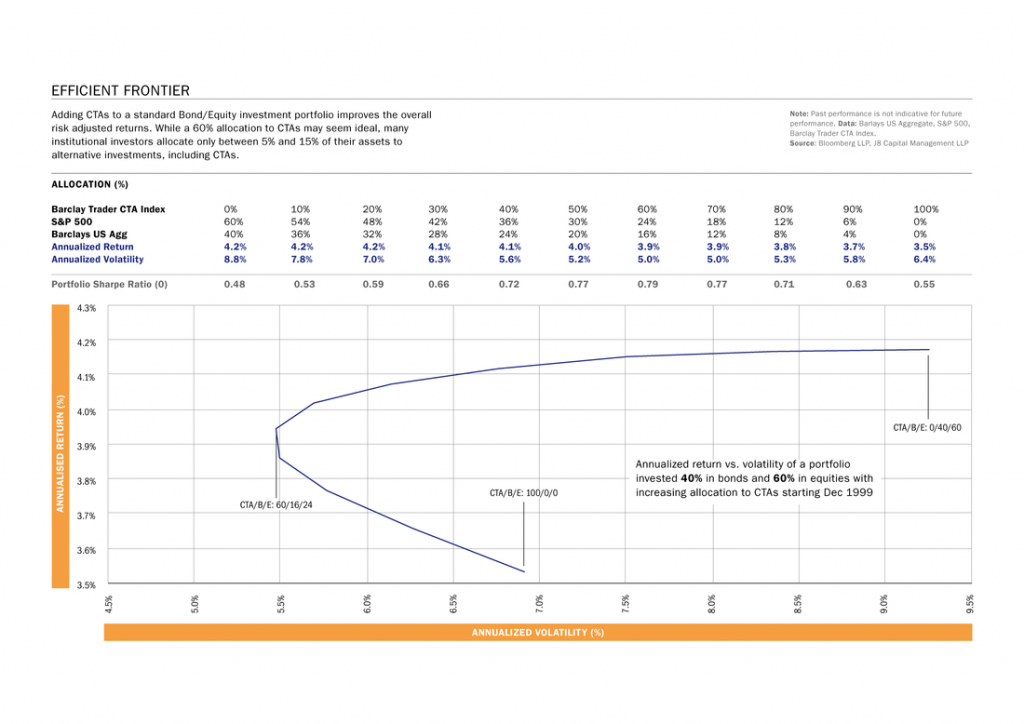
Adding CTAs to a standard Bond/Equity investment portfolio improves the overall risk adjusted returns. While a 60% allocation to CTAs may seem ideal, many institutional investors allocate only between 5% and 15% of their assets to alternative investments, including CTAs.
Eine Beimischung von CTAs zu herkömmlichen Renten/Aktien Portfolios verbessert das Risikobereinigte Ertragsprofil. Auch wenn eine 60%itge Allokation zu CTAs ideal erschiene, allokieren viele institutionelle Investoren nicht mehr als 5% bis 15% Ihrer Mittel in alternative Anlageklassen, CTAs inbegriffen.
How do CTAs work? Video (EN/DE)
How do CTAs work?
Wie funktionieren CTAs?
In 2014, 15 and 17, we partnered with the Nanyang Technological University in Singapore and have conducted international surveys on CTAs.
- What are the most common markets traded?
- What is the most common method to calculate position signals?
- How are assets allocated?
- How is risk managed and controlled?
- And what are the common fee structures?
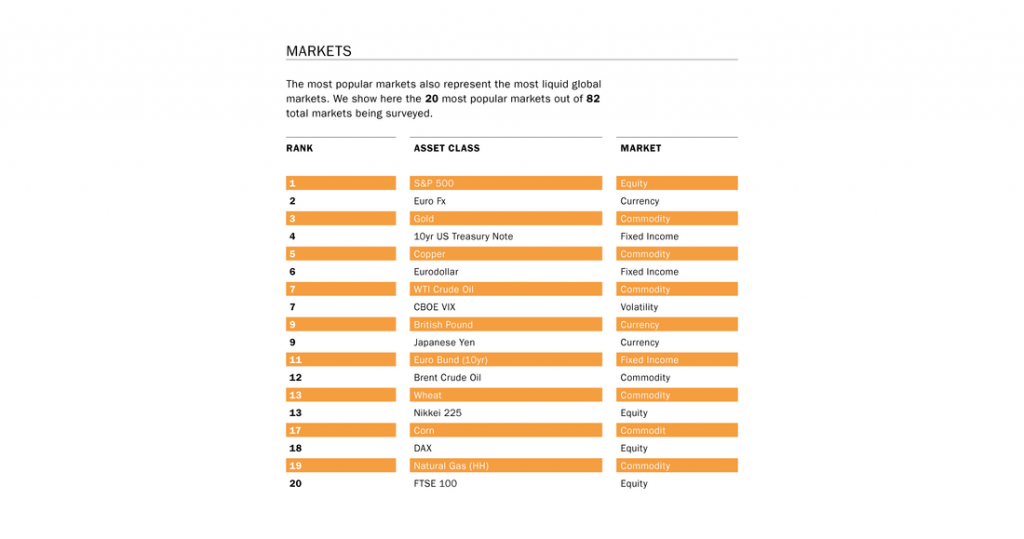
The most popular markets also represent the most liquid global markets. Here are the most popular 20 markets out 82 total markets that were surveyed.
2014, 15 und 17, haben wir zusammen mit der Nanyang Technological University in Singaur internationale Umfragen zur CTA Industrie durchgeführt.
Wir haben gefragt:
- Was sind die am häufigsten gehandelten Märkte?
- Was ist die weit verbreiteste Methode um Richtungssignale zu berechnen?
- Wie werden Anlageklassen gewichtet?
- Wie wird Risiko gemanagt und kontrolliert?
Die am häufigsten gehandelten Märkte sind zugleich auch die liquidesten Märkte. Dies sind die 20 meist gehandelten Markte aus insgesamt 82 untersuchten.
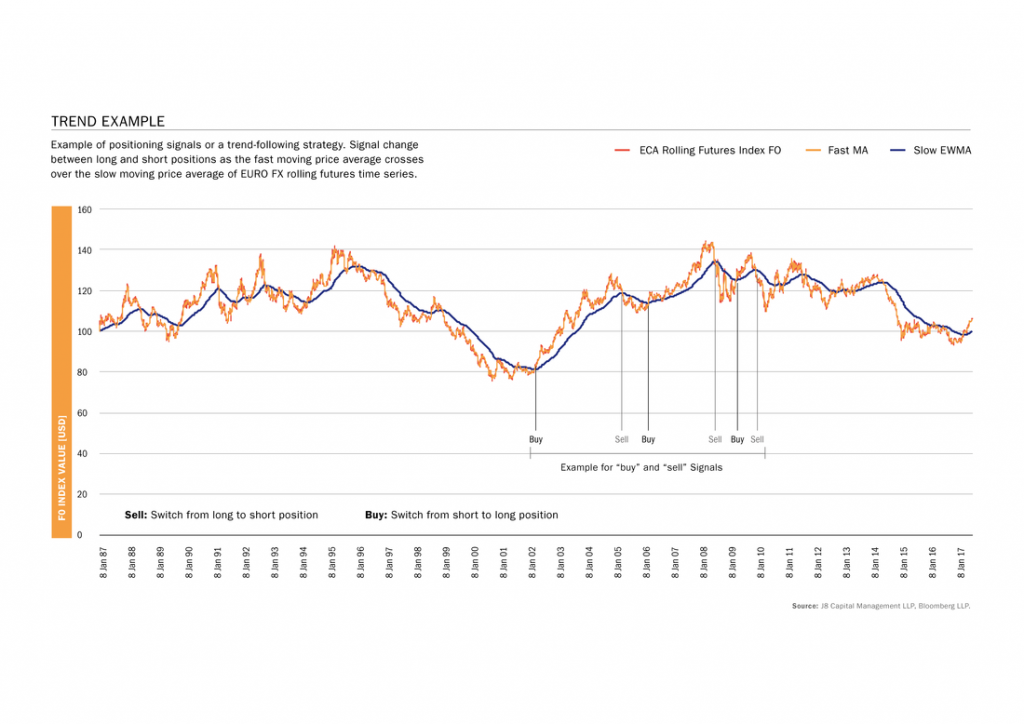
Most CTAs use trend following strategies to determine their long or short position signals. They can profit from rising as well as falling markets. In a simplified example, a trend following strategy takes a long position when the fast moving price average crosses above the slow moving price average and a short position when it crosses below. Some CTAs use arbitrage strategies to profit from relative price differentials between underlying assets or term structures.
Die meisten CTAs benutzen Trendfolgestrategien um ihre Richtungssignale zu bestimmen. Sie können sowohl von steigenden als auch fallenden Märkten profitieren. In einem vereinfachten Beispiel bestimmt die Trendfolgestrategie eine „Long Position“, wenn der kurzfristige Preisdurchschnitt über dem langfristigen liegt und eine „Short Position“ wenn er darunterliegt. Einige CTA benutzen auch Arbitrage Strategien um Preisunterscheide in verwandten Märkten oder der Terminkurve auszunutzen.
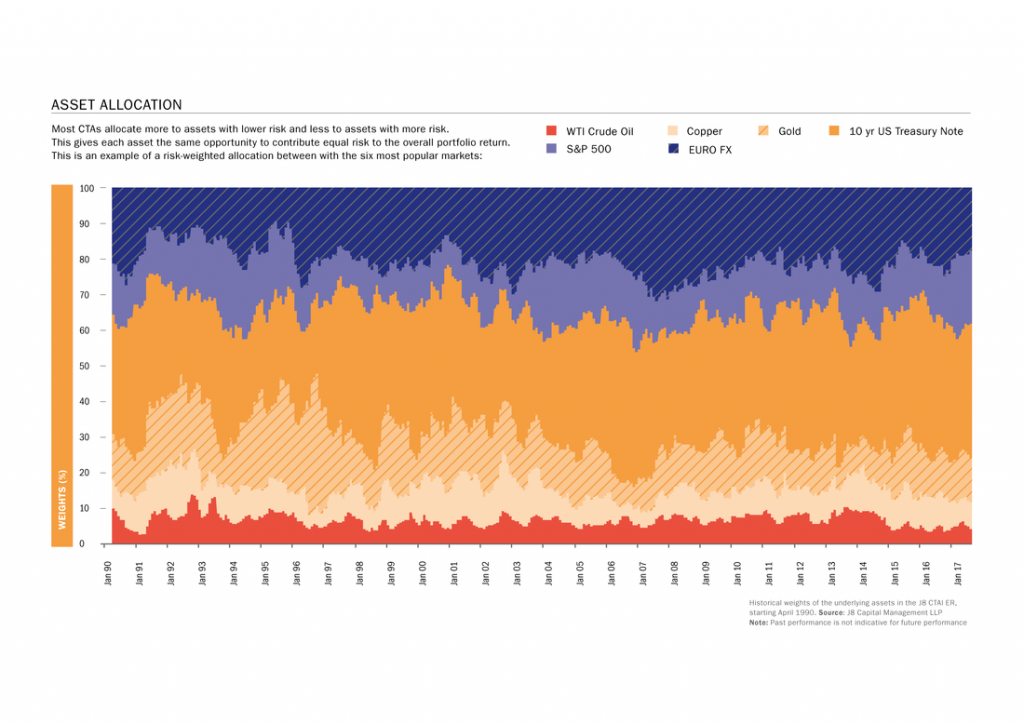
Most CTAs allocate more to assets with lower risk and less to assets with higher risk. This gives each asset the same opportunity to contribute equal amounts to the overall portfolio return. This is an example of an asset allocation between the six most popular markets.
Die meisten CTA investieren einen größeren Anteil ihrer Strategie in Märkte mit geringerem Risiko und weniger in Märkte mit höherem Risiko. Jeder Markt hat somit ein vergleichbares Potenzial zum Gesamtertrag der Strategie beizutragen.
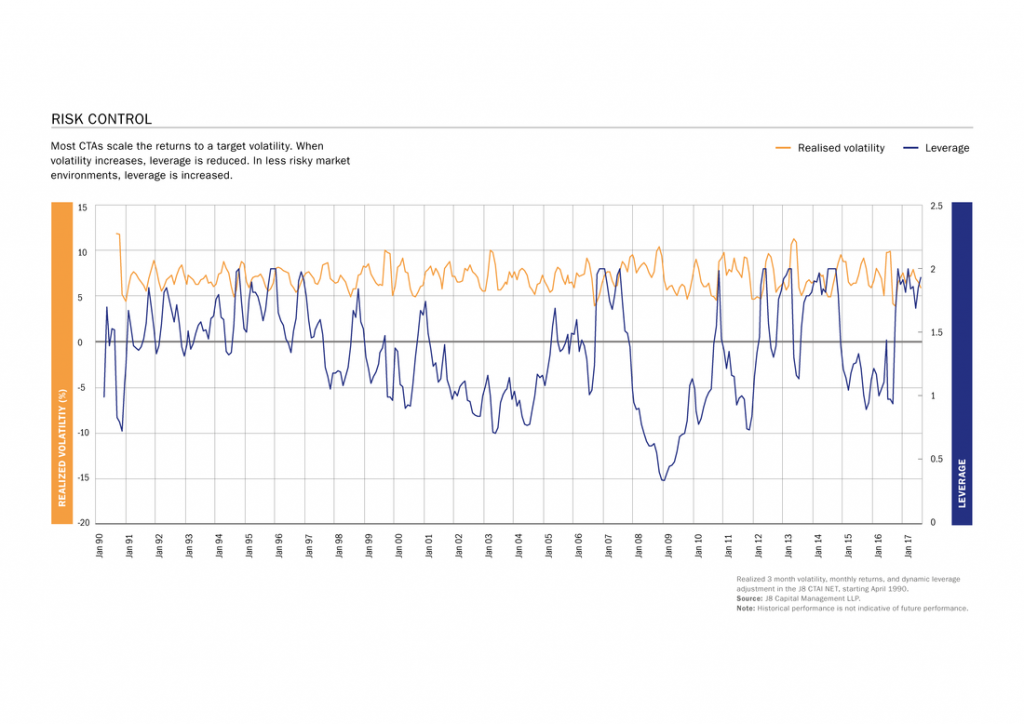
Most CTAs scale the returns to a target volatility. When volatility increases, leverage is reduced. In less risky market environments, leverage is increased.
Zur Risikokontrolle skalieren die meisten CTAs die Portfoliorenditen auf eine Zielvolatilität hin. In unruhigen Marktphasen wird der Investitionsgrad reduziert, und in ruhigen Marktphasen erhöht.
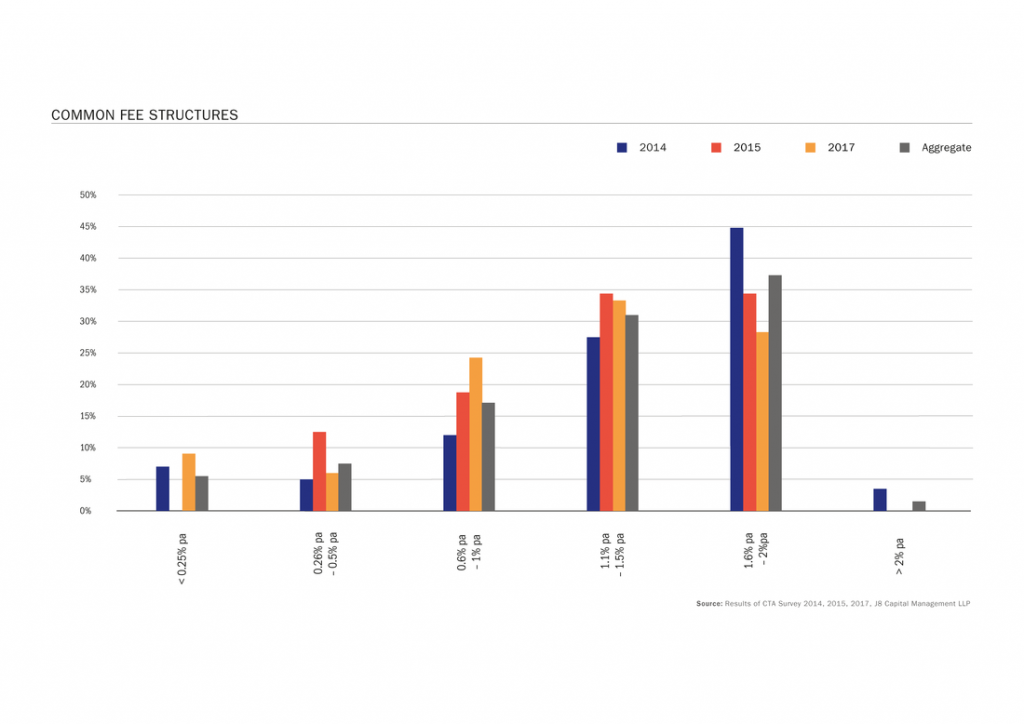
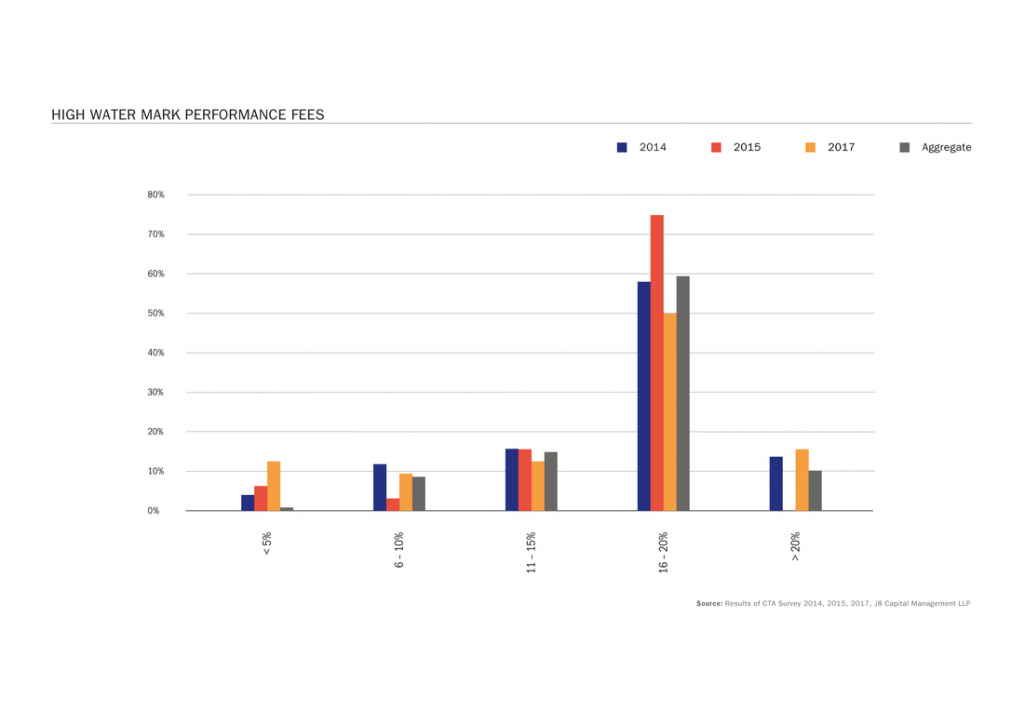
Most CTAs charge a classical 2/20 fee structure, this is a 2% per annum management fee and a 20% high water mark performance fee. In recent years the fee structure has come under pressure, with management fees ranging in many cases between 1% and 1.5% per annum. The performance fees remain unaffected, and hurdle rates are uncommon.
Die meisten CTAs nehmen eine klassische 2/20er Gebührenstruktur, in der 2% pro Jahr Verwaltungsgebühr und 20% Erfolgsprämie veranschlagt werden. In den vergangenen Jahren ist die Gebührenstruktur jedoch unter Druck geraten. In vielen Fällen werden die Verwaltungsgebühren auf 1% bis 1.5% pro Jahr gesenkt, Jedoch bleiben die Erfolgsprämien unverändert. Schwellensätze sind unüblich.
The CTA value proposition. Video (EN/DE)
The CTA value proposition
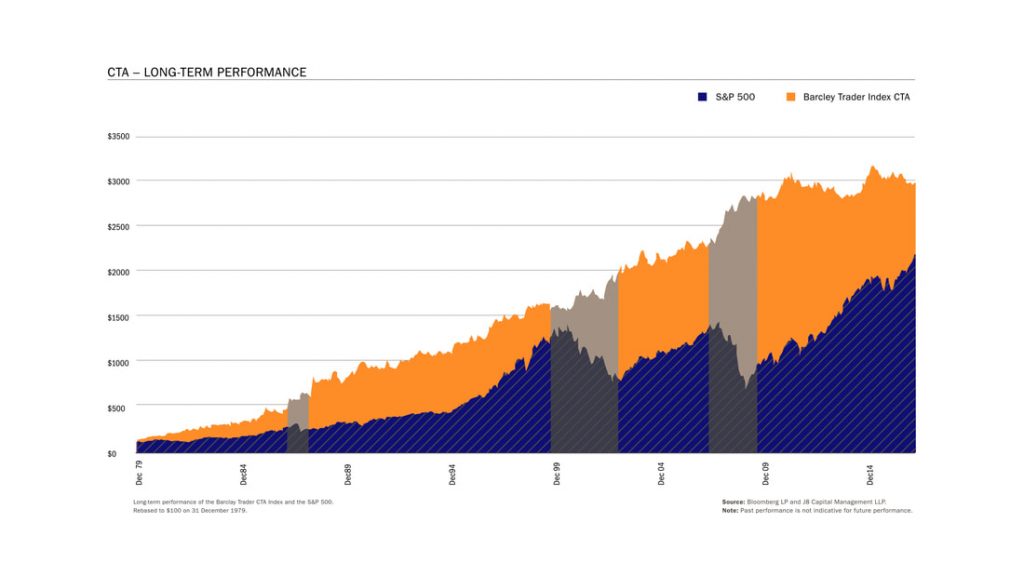
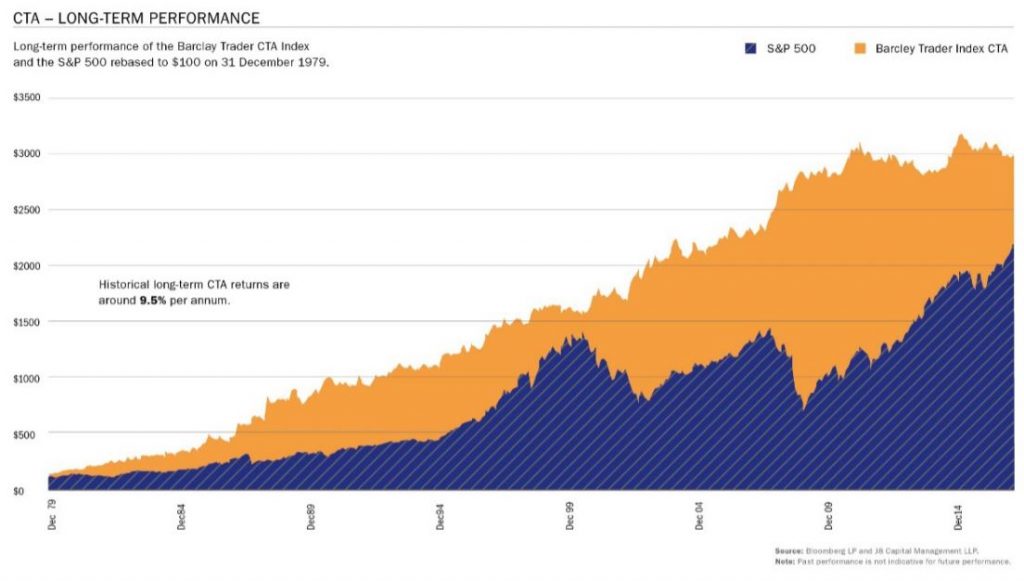
Historically, CTAs show profitability over an entire business cycle, however the return stream can be lumpy. The long-term value proposition of CTAs includes portfolio protection, portfolio diversification, and capital appreciation. In other words, CTAs are like an insurance policy against severe market downturns, only that they also pay a premium.
This graph shows how CTAs are generating long term positive returns and offering portfolio protection during significant market down turns.
Das CTA Nutzenversprechen
Historisch gesehen generieren CTAs positive Ertraege über einen gesamten Wirtschaftszyklus hinweg, wobei es auch Verlustphasen gibt. Das langfristige Nutzenversprechen von CTAs beinhaltet Portfilioabsicherung, Portfoliodiversifizierung, und Kapitalzuwachs. In anderen Worten fungieren CTAs wie Versicherungspolicen gegen starke Marktbereinigungen, nur mit dem Unterschied, dass sie darüberhinaus auch noch Gewinne erzielen.
Dieser Graph verdeutlicht die langfristige positive Ertragskraft von CTAs und wie sie als Schutz in schwachen Marktphasen wirken können.
Most CTAs use systematic trading strategies. Systematic trading strategies help to reduce behavioural bias and operational risk. The investment process is replicable in nature and they use long data histories for testing. This creates greater investment confidence.
Die meisten CTAs benutzen systematische Handelsstrategien. Systematische Handelsstrategien schließen den Eingriff menschlicher Emotionen in den Anlageprozess aus, wobei die Zuverlässigkeit der zugrundeliegenden mathematischen Modelle anhand langer historischer Datenreihen getestet wird. Dadurch wird Vertrauen in diese Strategien hergestellt.
J8: About us - Interview. Video (EN/DE)
We discuss our motivation, unique selling point, and value proposition of J8 Capital.
Wir stellen unsere Motivation, Alleinstellungsmerkmale, und Nutzenbeitrag von J8 Capital vor.
What is a CTA? Video (EN/DE)
What is a CTA?
A Commodity Trading Advisor, “CTA”, is defined by the U.S. Commodity Futures Trading Commission (CFTC) and National Futures Asociation (NFA) as “an individual or organization that, for compensation or profit, advises others, directly or indirectly, as to the value of or the advisability of trading futures contracts, options on futures, retail off-exchange forex contracts or swaps.”
Many CTAs trade broad and diversified portfolios using futures, options and swaps in fixed income, currency, commodity, and equity markets. They use technical and fundamental analysis to derive their trading decisions.
Was ist ein CTA?
Der Commodity Trading Advisor, „CTA“, wird von den Aufsichtsbehörden in den USA definiert als “[…] ein Individuum oder eine Organisation, das gegen ein Entgelt oder Profit, andere direkt oder indirekt über die Anlage in Warentermingeschäfte, Optionen auf Warentermingeschäfte, außerbörsliche Währungsgeschäfte oder Swaps berät.
Viele CTAs handeln ein breit diversifiziertes Portfolio aus Warentermingeschäften, Optionen, und Swaps. Sie handeln Renten, Währungen, Rohstoffe, und Aktienmärkte. CTAs benutzen sowohl technische als auch fundamentale Analysen um ihre Handelsentscheidungen herbeizuführen.
Most CTAs use systematic trading strategies with computer programs, but there are also discretionary managers or managers that use a mix of both.
Die meisten CTAs benutzen systematische Handelsstrategien mit Computerprogrammen, doch es gibt auch rein diskretionäre Manager oder Manager die beides verwenden.
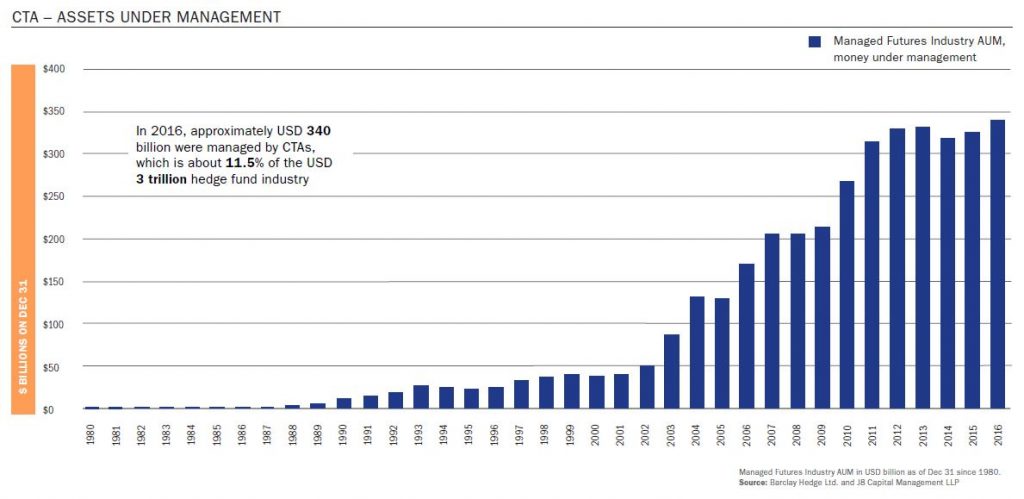
The CTA was first recognized in US legislation in 1974. In 2016, approximately 340 billion dollars were managed by CTAs, which is about 11.5% of the 3 trillion dollar hedge fund industry.
Der CTA wurde erstmals 1974 in der US Gesetzgebung erwähnt. 2016 wurden etwa 340 Milliarden Dollar von CTAs verwaltet. Das entspricht etwa 11.5% der 3 Billionen Dollar großen Hedge Fund Industrie.
On 25th September 2017, the Alternative Investment Management Association (AIMA) and Societe Generale published a paper on CTAs: “Riding the wave – Why you should consider allocating to CTAs”. It highlights investor benefits, performance characteristics, sector characteristics, and popular misconceptions associaed with Managed Futures investing.
Earlier this year, we were invited to review and provide comments, which we did.
Sources:
http://www.cftc.gov/index.htm
https://www.barclayhedge.com
https://www.aima.org
An investor asked: "Are CTAs a crowded trade"?

We concluded that in relations to the global total derivatives markets, CTAs take such small and dissimilar positions that they do not pose liquidity risks when it comes to simultaneous unwinds.
Story:
Recently, an investor asked if investing in CTAs was investing in a crowded trade. We think not!
A) According to the Bank of International Settlement (BIS), the total notional outstanding in derivatives in 2016 was $444 trillion. CTAs manage approximately $350 billion assets under management (BarclayHedge). Assuming an average leverage of 200% across the CTA and Managed Futures industry (CTA survey), CTAs manage approximately $700 billion in notional outstanding. CTAs only make 0.16% of the total notional outstanding in derivatives.
B) Looking at segments and the most crowded: The typical CTA allocation holds 35% in bonds/interest rates, 30% in commodities, 20% in currencies, and 15% in equity linked derivatives (CTA survey). According to BIS data, commodities are the smallest derivatives segment with total notional outstanding of $1.35 trillion. Using same assumptions as above allocated 15% of total notional outstanding in commodities being held by CTA. This matches CFTC data suggesting about 15% of commodity futures are held by speculators. 15% market share does not constitute a crowded market.
Conclusion:
In respect of the total global derivatives markets and the US Treasury’s definition of a crowded trade, we conclude that CTAs have such small and dissimilar positions that they offer little risk in terms of insufficient liquidity, should market participants seek to unwind their positions simultaneously. CTAs are therefore not a crowded trade.
Sources:
https://definedterm.com/crowded_trade
http://www.bis.org/
http://www.cftc.gov/index.htm
https://www.barclayhedge.com/
http://www.j8capital.com/j8-cta-index.html
